
Adeyemo Oluwatimileyin .E.
📊 Aspiring Data Analyst | Power BI • EXCEL• SQL
An Interest in IT and Research has led me to the field of Data Analytics
email:[email protected]
contact:+234 9028003195
Technical Skills
+ EXCEL
+ POWER BI
+ SQL
About Me
I'm Adeyemo Oluwatimileyin, an aspiring data analyst actively developing skills in Power BI, SQL, and Excel. I have a strong interest in using data to uncover insights, improve business performance, and support evidence-based decision-making.Currently focused on building real-world projects, I’m seeking internship opportunities where I can apply my knowledge, learn from experienced professionals, and contribute to meaningful data-driven work. I’m a fast learner, detail-oriented, and passionate about growing in the analytics field through hands-on experience.
COMPLETED DATA ANALYSIS PROJECTS

Tools Used: Power BI, Excel, Power Query
OBJECTIVE: To analyze and visualize crime patterns across Indiana in 2023 using quarterly data, with the goal of uncovering trends by age group, sex, race, county, and offense type.
APPROACH: I consolidated four quarterly Excel files, cleaned and transformed the data in Power BI, and built an interactive dashboard to visualize crime trends across counties, demographics, and offense types.
IMPACT: The dashboard enabled law enforcement agencies to quickly identify crime hotspots, monitor demographic trends, and allocate resources more effectively for crime prevention and intervention.
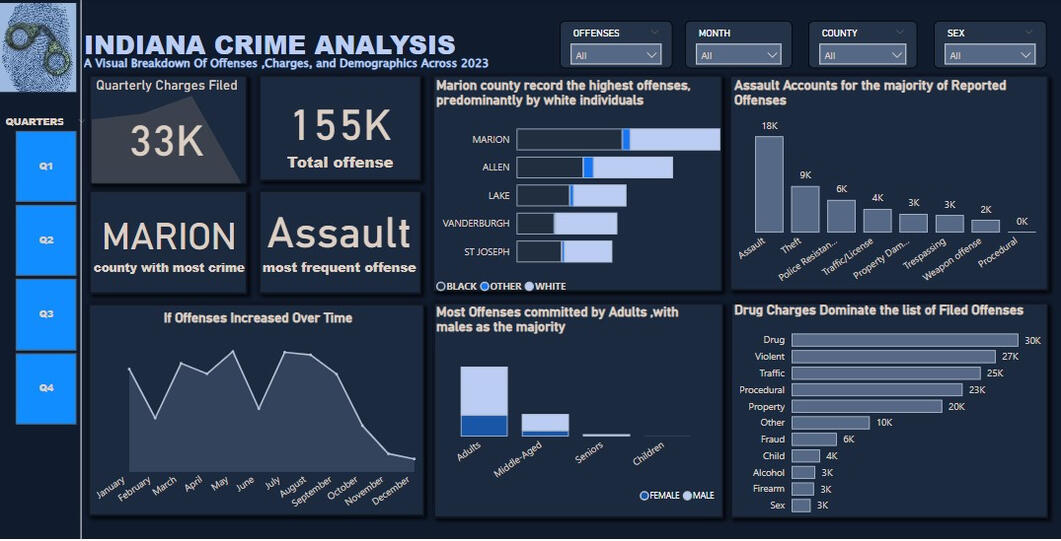
INSIGHTS
Marion County recorded the highest number of offenses in 2023, with white individuals representing the majority.
Assault was the most common offense, followed by theft and drug-related crimes.
Adults, particularly males, accounted for the majority of reported offenses.
Drug offenses topped the list of charges, totaling over 30,000 cases.
Crime peaked around mid-year and declined significantly toward December

Tools Used: Power BI, Excel, Power Query
OBJECTIVE: To analyze sales performance and predict customer response to a proposed Gold Membership campaign.
APPROACH: Processed transactional data to segment customers based on purchase behavior, frequency, and category interest.
IMPACT: Supported data-driven marketing strategies and improved targeting for loyalty programs.
INSIGHTS
443K Gold Memberships sold, driven by a focused campaign across 2,000 customers with an average income of 53K.
Higher acceptance rates were observed within 0–20 days, showing early follow-ups significantly boost conversions.
Only a small portion of total calls led to successful conversions, highlighting a need for improved customer engagement strategies.
Customers with $240K–$480K income range showed the highest acceptance, indicating a strong target segment for future offers.

Tools Used: Power BI, Excel, Power Query
OBJECTIVE: To evaluate hospital operations, patient flow, and department-level performance.
APPROACH: Analyzed hospital data including patient visits, treatment outcomes, and satisfaction ratings. Built a dashboard to monitor KPIs such as patient wait time, discharge rate, and departmental efficiency.
IMPACT: Enabled actionable insights for improving healthcare delivery, resource planning, and patient experience.
INSIGHTS
Average billing amount stands at 25.54K, indicating high treatment costs per patient.
Lipitor is the most prescribed medication, pointing to widespread cholesterol-related cases.
Blood type A- is most common, guiding blood bank stocking and emergency readiness.
LLC Smith and Ltd Smith lead in admissions, showing where patient load is highest.

TOOLS USED: Power BI, Excel, Power Query
OBJECTIVES: To visualize personal listening habits and uncover trends in music consumption.
APPROACH: Cleaned and transformed Spotify streaming history data to build an interactive dashboard highlighting key metrics such as top artists, genres, track frequency, and listening times.
IMPACT: Provided a clear view of music preferences, useful for playlist curation, mood mapping, and user behavior analysis.
INSIGHTS
Discovered peak listening hours across weekdays and weekends.
Identified top 10 most streamed artists and genres.
Tracked listening consistency over time to understand mood-based listening patterns.
Learning and Certificates
Microsoft Certified: Power BI Data Analyst Associate (PL-300)
Gained hands-on expertise in modeling, visualizing, and analyzing data with Power BI to deliver actionable insights.